Exploring fraud patterns in insurance claims through smart, interactive data visuals.
Short Description (for preview / card view)
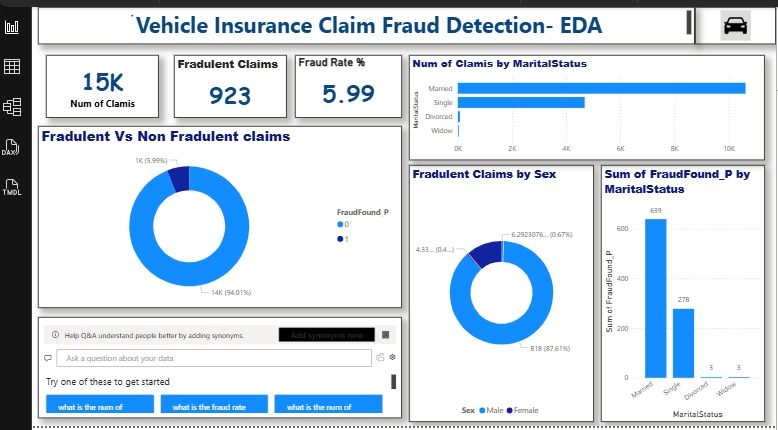
A Power BI dashboard that visualizes patterns in fraudulent insurance claims. It explores relationships between claim frauds, vehicle details, and policyholder demographics.
Full Description (for “View Project” page)
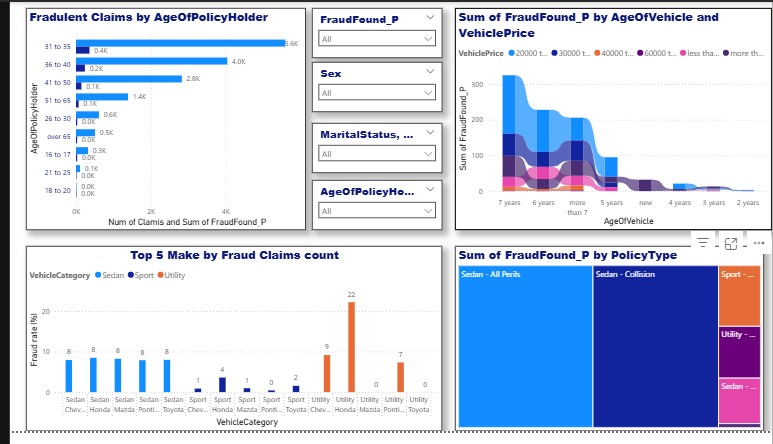
This Power BI dashboard analyzes insurance claim data to uncover fraudulent behavior patterns and high-risk segments. It visualizes fraud counts by age group, vehicle type, policy type, and vehicle price, helping identify common factors behind fraudulent claims.
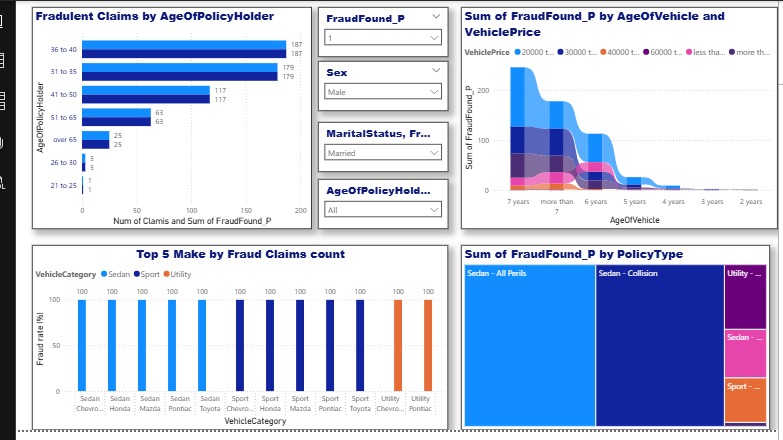
Users can filter by age, gender, marital status, and policy type to explore fraud trends and detect anomalies. The report also identifies the top 5 vehicle makes involved in fraudulent claims and displays fraud distribution across different policy categories.
Built using data modeling, DAX measures, and interactive visuals, the project highlights expertise in Power BI analytics, fraud detection, and business intelligence — turning raw claim data into actionable insights.