Pizza Place Sales Report Dashboard (Power BI)
Visualizing pizza sales trends and performance through interactive Power BI analytics.
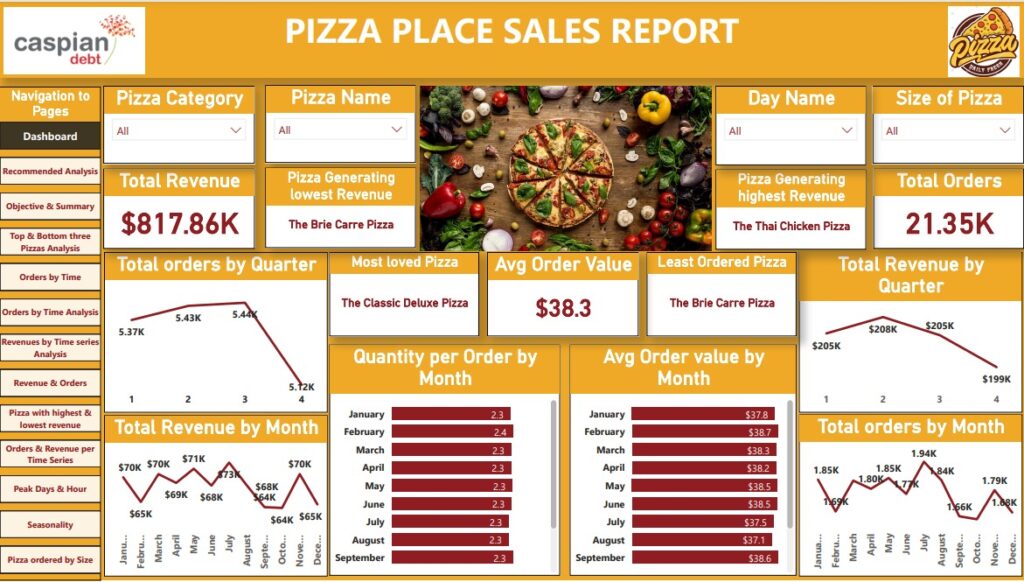
A Power BI dashboard analyzing pizza sales performance. It tracks total revenue, orders, and average order value while revealing top-selling pizzas, seasonal trends, and customer favorites.
This project presents an interactive Power BI dashboard that analyzes sales data from a pizza restaurant. The report highlights key performance metrics such as total revenue, total orders, and average order value, helping identify trends that drive business growth.
Users can filter data by pizza category, size, and day of the week to explore insights such as the most and least ordered pizzas, highest-revenue items, and monthly/quarterly performance trends.
The dashboard also visualizes sales and quantity per order by month, making it easy to spot peak demand periods and customer preferences.
Built using Power BI visuals, DAX measures, and interactive slicers, this project demonstrates skills in data storytelling, sales analysis, and dashboard design, transforming restaurant sales data into meaningful insights.