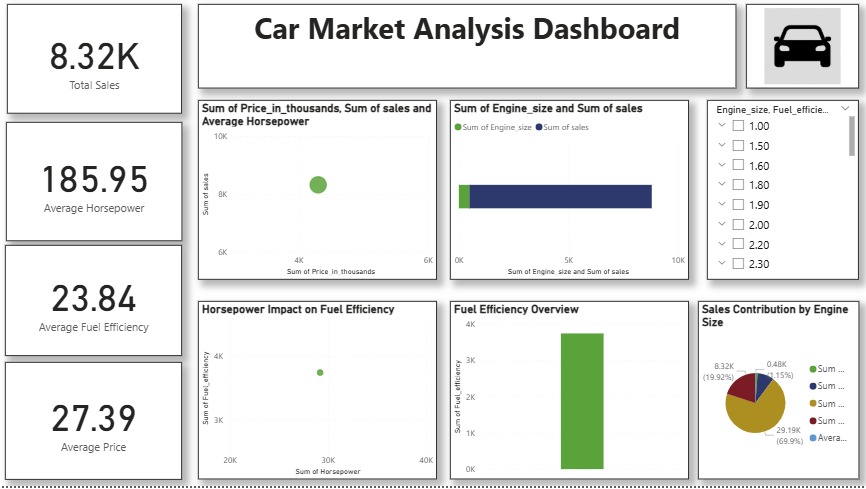
Car Market Analysis Dashboard (Power BI)
Exploring car sales performance and fuel efficiency through interactive Power BI visuals. Short Description (for preview / card view) A Power BI dashboard analyzing car market performance. It visualizes total sales, pricing, horsepower, and fuel efficiency to identify key market trends and vehicle performance insights. Full Description (for “View Project” page) This Power BI dashboard […]
Car Market Analysis Dashboard (Power BI) Read More »