Exploring car sales performance and fuel efficiency through interactive Power BI visuals.
Short Description (for preview / card view)
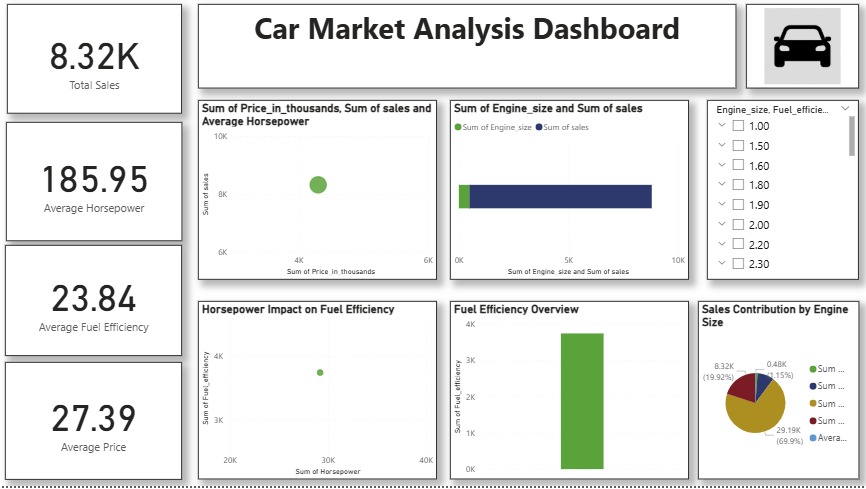
A Power BI dashboard analyzing car market performance. It visualizes total sales, pricing, horsepower, and fuel efficiency to identify key market trends and vehicle performance insights.
Full Description (for “View Project” page)
This Power BI dashboard provides a detailed analysis of the car market, exploring relationships between price, horsepower, fuel efficiency, and sales performance. It helps users understand how different engine sizes and vehicle attributes impact overall sales trends.
Key metrics displayed include total sales (8.32K), average horsepower (185.95), average fuel efficiency (23.84), and average price (27.39K). The visuals highlight correlations between price and sales, horsepower and efficiency, and sales contribution by engine size.
The dashboard’s interactive filters allow users to segment data by engine size and fuel efficiency, making analysis intuitive and flexible.
Built using Power BI data modeling, DAX measures, and chart visuals, this project demonstrates skills in automotive data analysis, performance visualization, and business intelligence reporting.