Turning sales data into clear business insights through Excel visualization.
🩵An interactive Excel dashboard analyzing Ali Store’s 2022 sales performance. It highlights revenue trends, customer demographics, top states, and sales channels using dynamic charts and slicers.
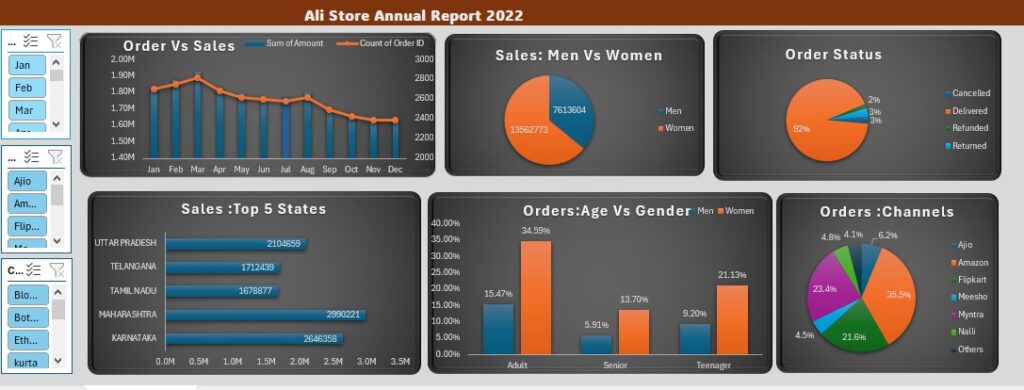
This project showcases a comprehensive Excel dashboard built to analyze Ali Store’s Annual Report for 2022. Using Pivot Tables, charts, and slicers, it transforms raw sales data into actionable business insights.
The dashboard covers monthly order and sales trends, men vs women customer distribution, top-performing states, and sales channel performance across Amazon, Flipkart, Meesho, Myntra, and more. It also visualizes order status and age-group analysis by gender to reveal deeper behavioral patterns.
Designed with a modern, dark-themed layout, this project highlights skills in data visualization, reporting, and Excel automation, helping to present data in a visually engaging and decision-oriented format.